

Share This Article
On Tuesday the Select Board took a final vote to ratify their prior vote on tax classification. This is when the Select Board, with the help of the Board of Assessors and the Assessor’s department, gets to “determine the percentage of local tax levy which will be borne by each class of real and personal property, relative to setting the Fiscal Year 2024 tax rate.”
In other words: this is part of the process that determines everyone’s final tax bill. But what’s the bottom line for the typical resident?
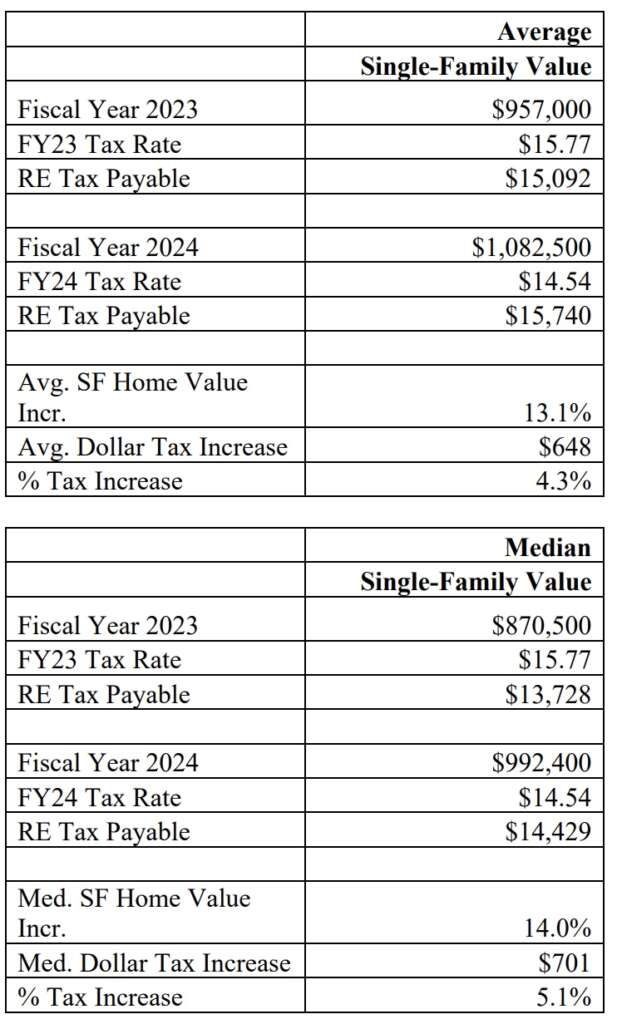
The tax rate is going down. And the assessed value of your property is probably going way up. But that means your final tax bill is likely going up a bit as well.
Here are the examples given in the Select Board packet (page 11):
FY24 assessed property values were recently noticed on the Town website. You can access that now-archived page, as well as assessments for any properties you may own in Sudbury, here. That page lays it out pretty clearly for residents:
“The past several years have seen property values surge. Sudbury taxpayers may see their valuations increase by 20-percent or more. Ten years ago the average single-family home carried a value of approximately $625,000. That same home today has an estimated value of $1,082,466 most of the appreciation having been realized over the past several years. Adjusting values to correct for this trend is necessary to insure property owners have a sense that their home has been fairly valued. Taxpayers should understand that revaluations do not in and of themselves generate more tax revenue. We anticipate a reduction in the town’s tax rates.”
One thing that we learned in the Select Board meeting last week was that growth in values varied a bit across property types:

As the assessor’s notice said, changes in assessed values are largely market driven, though renovations and improvements can also contribute to increasing values. The other main factor is the periodic inspections of your house by the assessors that may notice added features since the last inspection. You can learn more about those on their FAQ page here.
The tax rate has been dropping as values have been surging in recent years. That’s no big surprise. But if you’d like to review the historic data, or even just a great map visualization of tax data in the state, the Massachusetts Division of Local Services has some handy resources here.