


Share This Article
According to the Open Government Partnership, “transparency occurs when ‘government-held information (including on activities and decisions) is open, comprehensive, timely, freely available to the public, and meets basic open data standards…’”
Based on that standard, the Town of Sudbury took a significant step to increase transparency on Friday, April 25, when it published nearly 200 pages of financial analysis spanning the last decade. The Fiscal Year 2017- Fiscal Year 2026 Financial Report and Reference Guide provides “a concise overview of financial performance from Fiscal Year 2017 through Fiscal Year 2026” according to the Town website. It goes on to state “This comprehensive document includes detailed tables comparing Sudbury with other communities and provides insights into significant financial data, budget trends, and future projections.” The report was prepared by Finance Director Victor Garofalo.
“Comprehensive” may be a bit of an understatement. Sudbury Weekly reviewed the report in detail and found a treasure trove of data-rich visualizations chronicling Town revenue and expenditures since Fiscal Year 2017. The report provides a detailed view into Town government spending, but it also provides comparisons to over a dozen similar communities in Massachusetts. It goes so far as to compare department-level spending per capita with each of the other communities included in the analysis.
The Town’s announcement pointed out “While some statistics may vary in the range of years covered due to data availability, the report adheres to Generally Accepted Accounting Principles to ensure accuracy and reliability. Data sources include state agencies, the town’s financial statements, internal systems, and operational reports.”
The Highlights
The volume of new insights contained in the report can’t be covered in a single article, so Sudbury Weekly will be featuring some of the data in a series of future articles. However, there are a few surprising insights that are worth calling out in this initial piece.
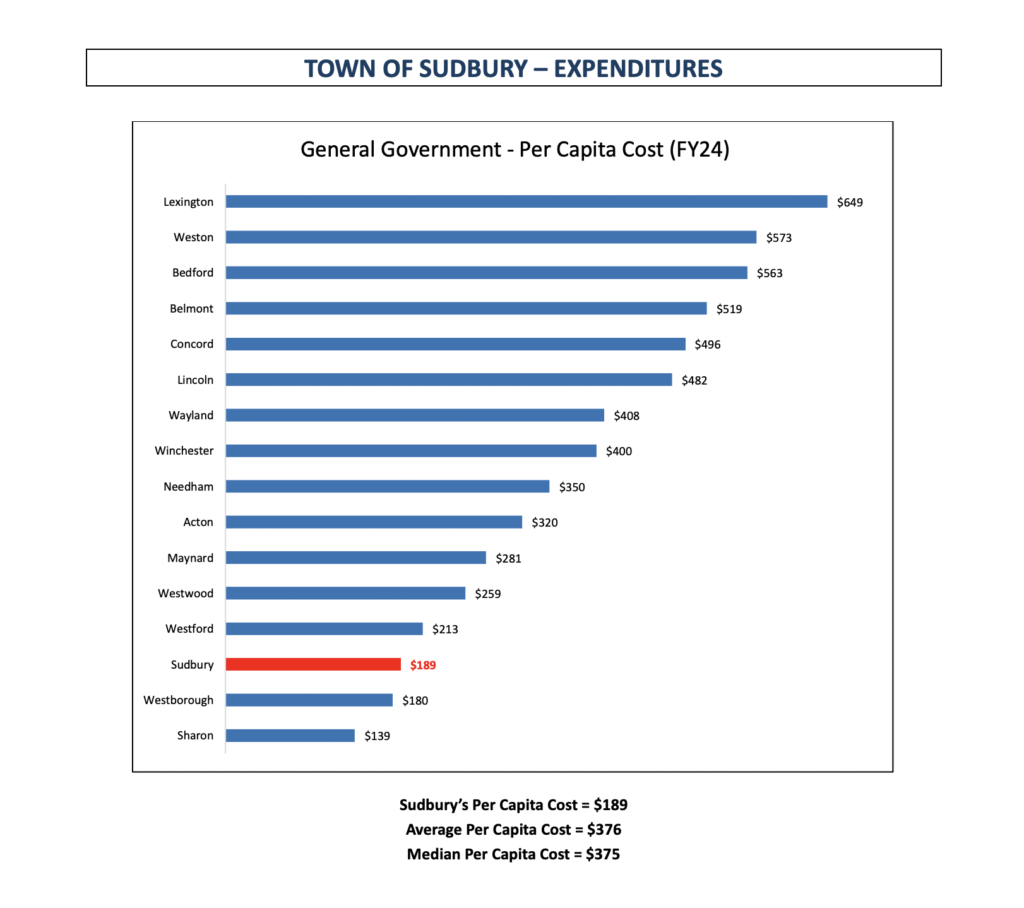
For example, Sudbury spends the third least, per capita, on General Government:
With regard to public safety, Sudbury is spending a bit above the median (per capita) for the Fire Department (page 74) , but below the median (per capita) for the Police Department.

One unsurprising chart highlights expenditures per capita on education. Sudbury is among the top spenders on education among the towns in the report. But note the text above the chart – the SPS employee benefits aren’t included in this number as they are covered in a separate section of the report.
The report also adds some new perspectives on education spending. While Sudbury has one of the higher costs per capita for education, the blended cost per pupil is on the lower end of the other towns. In fact, Sudbury’s per pupil cost is roughly two-thirds of what Weston and Lincoln are spending. When Lincoln-Sudbury is isolated out, it shows that Sudbury spends among the most per pupil on high school education among other regional schools.
Revenue Challenges
Town Manager Andy Sheehan has repeatedly emphasized in recent years that revenue was a bigger concern than expenditures in Sudbury. This report appears to hammer home that point with an exhaustive set of datapoints.
While the report documents expenditures at an entirely new level of granularity, one of the most striking insights is what the report doesn’t explicitly state: Sudbury is downright frugal in virtually all areas, other than education, when compared to other Towns.
Take, for example, the Department of Public Works (DPW). Sudbury is spending more than the median (per capita) cost on the DPW, but less than the average. This is one of the few Town departments where Sudbury isn’t in the lower rungs of spending compared to the other towns in the report. However, the report presents additional staffing data and comparisons to interpret. Sudbury’s DPW is managing more miles of road per employee than all but one other community in the analysis���potentially indicating a high level of efficiency in service delivery, or perhaps indicating the department is understaffed.
Sudbury has a reputation for high taxes – and it is well-documented that the average single-family tax bill is among the 20 largest in the state. But when compared to similar communities, Sudbury is in the middle of the pack:
The challenge for Sudbury is that it’s almost entirely dependent on residential property taxes to fund its annual budget. The report highlights this in a visualization:
The announcement of the report included a warning to residents “Looking ahead, the town anticipates significant budgetary challenges beginning in FY2027. These challenges will necessitate difficult decisions regarding future services, staffing levels, and capital projects.”
The report conveys the tightening financial environment in its analysis of unused levy capacity. (Page 25) Unused levy capacity is defined in the report as “the difference between the maximum tax revenue a municipality is permitted to raise under Proposition 2 ½ rules (levy limit) and the tax revenue actually raised (levy).” Sudbury is using effectively all of its levy capacity as of Fiscal Year 2025, and has the second lowest unused levy capacity in the analysis. Combined with weakening new growth over the last decade (page 22), the Town’s budget flexibility appears to be eroding.
Trying Times
The report paints a clear picture of Sudbury’s financial condition. On one hand, the Town appears to be delivering similar services to other towns, even with less spending in many major functional areas. On the other hand, the Town is at the end of its financial rope.
The Town isn’t growing significantly anymore, and it remains dependent on residential property taxes at a time when costs are skyrocketing. That presents the community with tough choices. While the Town has discussed diversifying the tax base for as long as anyone can remember, growing the commercial or industrial tax base would likely take years, if not decades.
The choice appears to be between cutting services that Sudbury arguably delivers at lower cost than peer communities, or an override that adds further tax burden to one of the highest single-family tax bills in the state. Uncertainty in the broader macroeconomic climate only adds to the difficulty of such discussions. Yet there’s no obvious area in this report where Sudbury is significantly outspending peer communities and could very easily absorb budget cuts.
A good example of this is in Health and Human Services, which includes Sudbury’s Health Department, the Senior Center and the Veterans Affairs Office. Those three functions operate on roughly $1 million combined budget. That’s already 30 percent less than the median (per capita) in comparable towns, and less than 50 percent of what nearby Lincoln and Wayland are spending.
Clearing The Air
Comparative frugality is the prevailing theme in the report, even though there has been some talk about overtaxing in various committee meetings in recent months. The report clarifies multiple misconceptions about Sudbury’s finances.
Sudbury Weekly has covered some controversy regarding the level of free cash the Town generated in Fiscal Year 2025, but the comparison to peer communities puts that in new perspective. Sudbury’s strong free cash number was actually among the lowest four in the comparison:
Similarly, while many residents may think the Town has borrowed a lot of money to fund recent land acquisitions and capital projects, Sudbury’s debt service (as a percent of the budget) was the second lowest of all towns in the analysis.
The report offers an enormous amount of information about the Town’s financial status, and Sudbury Weekly will cover additional pieces of the report in upcoming stories. Upon initial review, one thing is certain: the Town has provided the data the community will need to have fact-based conversations about the challenging fiscal years ahead.