



Share This Article
Sudbury’s Assistant Town Manager and Finance Director, Victor Garofalo, has significantly expanded Sudbury’s financial reporting since joining the Town in 2024. His department’s nearly 200-page Financial Report and Reference Guide compares Sudbury’s finances to 15 comparable communities, providing context that helps taxpayers understand where Sudbury is similar and different to other communities.
Garofalo has also enhanced quarterly “budget to actual” reports, providing exhaustive detail to the Select Board both in memos and live presentations during their meetings. This is in addition to an award-winning budget presentation, and regular presentations and updates given to the Finance Committee.
The net impact of all the added reporting is that residents have a more comprehensive set of tools to help them understand not just how the money is spent, but which tradeoffs the Town is making in order to deliver services. That transparency provides a basis for more grounded discourse, it also reveals otherwise hidden insights.
A Timely Example
For example, there has been much talk about sidewalks in Sudbury. The Town has told residents that while the administration understands the desire for an improved and expanded sidewalk network in Sudbury, the Department of Public Works (DPW) has significant capacity limitations, and the costs are considerable.
At first blush, the budget book view would indicate that Sudbury has a well-funded DPW. In Fiscal Year 2027 (FY27) they have one of the largest of the Town Manager’s departmental budgets at $6.7 million. Setting education aside, the DPW has the second largest budget of all Town departments, a good distance behind Public Safety, which combines the Fire and Police Departments.
That spend puts Sudbury in the middle of the pack with its peer communities. The Town is spending approximately $248 per capita on the DPW. That’s below the average of peer downs, but above the median. Not too shabby, right?

Here’s the catch: The report also shows that Sudbury’s DPW department is managing considerably more miles of road than most peer communities. Only Lincoln manages more miles per full-time equivalent employee.
That context provides the basis for the capacity limitations Town leadership has expressed during sidewalk conversations. But the DPW doesn’t just manage roads and sidewalks. As the report states “The Public Works cluster includes Engineering, Streets and Roads, Trees and Cemeteries, Parks and Grounds, and
the Transfer Station Enterprise Fund.”
A little less than half the DPW budget goes to “Streets and Roads,” leaving five other subsidiary departments to split the remainder. (See graphic in the next section.)
Reporting on the same budget number with multiple different lenses creates a more complete picture for residents who otherwise may question the efficiency of the operations of the Town when looking only at the raw dollars going to a department.
A Personalized View
The latest view into the Town’s finances is actually a breakdown from the taxpayer’s perspective. Select Board Chair Janie Dretler requested that the Town show where the average tax bill goes during the Select Board’s discussion of the FY26 close-out. Garofalo presented it at the Finance Committee meeting on August 20. Here’s a copy that was provided by the Town:
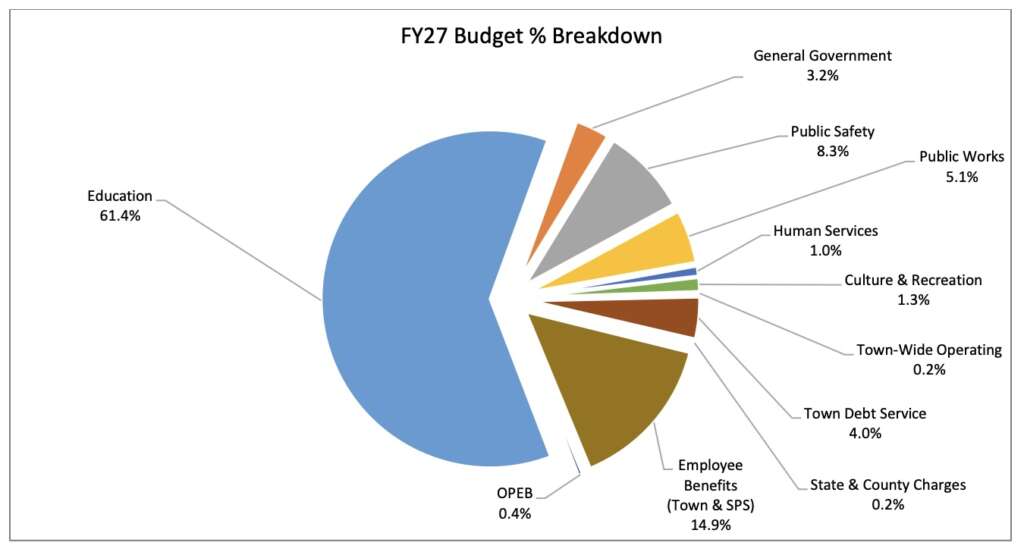
This view into the average residential tax bill highlights some points that are well-known. First, the majority of the tax bill goes to paying for education in Sudbury. On a $16.6K tax bill, almost $10K is going to education, and another $1,479 is going to SPS insurance and benefits. In total, about $11,500 goes to education… more than two-thirds of the bill, and that’s not even counting capital articles for the schools.
At the top of the graphic, the major bucket of expenses are listed. Sudbury’s debt service (which covers debt for land acquisitions like Liberty Ledge/Sewataro, or capital projects like the Fairbank Community Center, is a larger share of the tax bill than all of General Government. The General Government part of the budget “represents the Executive, General Administration, Human Resources Management, Legal, Financial and quasi-judicial functions of the Town.” You can see a break down of the sub-departments on the right side of the graphic.
Notably, taxpayers must authorize the debt at Town Meetings and/or at the ballot box, so the taxpayers themselves are the ones driving up that portion of the bill by choice. But is that debt excessive, on trend, or too light?
It turns out, the Financial Report and Reference Guide also has a chart for this. Sudbury’s debt as a percentage of the annual budget is among the lowest relative to peer communities.
That’s $757 for debt, and $538 for the totality of General Government. On one hand, those are noteworthy chunks of the average residential tax bill. On the other, they’re both relatively modest numbers in the context of comparable towns. General Government per capita is also the second-lowest among the peer communities in the Reference Guide, which is about half of what nearby Wayland is spending.
Big Bill, Little Details
Sudbury had the 16th largest average residential tax bill in the state in FY26. The Division of Local services tracks the data here. That’s a $1,390 monthly premium on top of the mortgage payment for the average value home in Sudbury. For context, that’s more than the second largest monthly expense for average American family, which is $1,100 for transportation. There’s no intellectually honest way to diminish the enormity of the residential tax bill. But it doesn’t tell the whole story. After the education share of the bill, which lands Sudbury among the heaviest spenders among peer communities, it’s hard to find many functional areas where Sudbury is spending as aggressively as its peers. And some of the departments represent a comically small share of the average tax bill. A few examples:
Recreation: With fall sports upon us, residents are sure to have opinions about field conditions and field amenities. For Town-owned fields, the average residential tax bill takes just $44.23 for Parks and Grounds. The rest of field maintenance is funded through user fees in the Park and Recreation department. And only $22.76 of the average tax bill goes to the Park and Recreation department. That department has enterprise and revolving funds so that it can largely self-fund it’s activities with user/program fees.
Conservation: The department is responsible for the stewardship of a whopping 900 acres of land. The entire department costs less than $300,000 per year. That’s 36 bucks on the average annual tax bill, or three bucks a month, or four cents per acre annually.
Public Safety: Public Safety is a good example of a mixed picture. The Sudbury Police Department is $614 of the average tax bill, while the Fire Department is $741. On one hand, Public Safety is the third largest chunk of the bill following Education then Insurance and Benefits. But jump over to the Reference Guide, and you’ll see that Sudbury is spending $507 per capita on Public Safety. That’s a bit less than the $582 average and the $552 median in comparable communities.
Drill down further, and you’ll find that Sudbury is spending above the average and the median on Police per capita. (Page 74) At the same time, Sudbury has the second lowest Police FTEs per 1,000 population of Sudbury’s peer communities.
The Fire Department is right in the middle of the pack for per capita cost and FTEs per 1,000 population. (Page 77)
Education and Everything Else
Spend enough time scrolling through the Financial Report and Reference Guide and you’ll quickly find that Sudbury has one area where it’s spending far more aggressively than most of its peer communities: education. On a per capita basis, Sudbury is number four, trailing only Weston, Concord and Lexington.
Here’s the wild part about this chart: it doesn’t include Sudbury Public Schools employee benefits. That’s roughly $11.5 million spent on SPS that isn’t captured by the chart, and Sudbury is still in the top five. (Page 122)
If a Town’s budget is an expression of priorities, there’s no doubt that education is Sudbury’s top priority. With a tightening financial forecast, a strong appreciation for education, and Town departments that are already leaner than most peer communities, Sudbury could face some truly difficult choices in the coming years. And that’s where all the financial reporting gets interesting. The new reports make it dramatically easier for residents to evaluate if the budget truly reflects their priorities.
Will that change how and where boards and committees advocate for funding? Will it change how voters vote? And will the increased transparency reduce the tug-of-war between cost centers?
Only time will tell.